surfht
Interactive contour plot
Syntax
Description
Examples
Create an Interactive Contour Plot
This example shows how to use surfht
to
create an interactive contour plot.
Create a grid of the (x,y)
domain from (-2,-2) to (2,2) using meshgrid
.
[x,y] = meshgrid(-2:0.2:2,-2:0.2:2);
Evaluate the function z(x,y) = x × exp(-x2 – y2) over this domain.
z = x.*exp(-x.^2 - y.^2);
Open an interactive contour plot. Since meshgrid
creates
a grid of the x and y values,
open the plot using the first row of x and the
first column of y.
surfht(x(1,:),y(:,1),z)
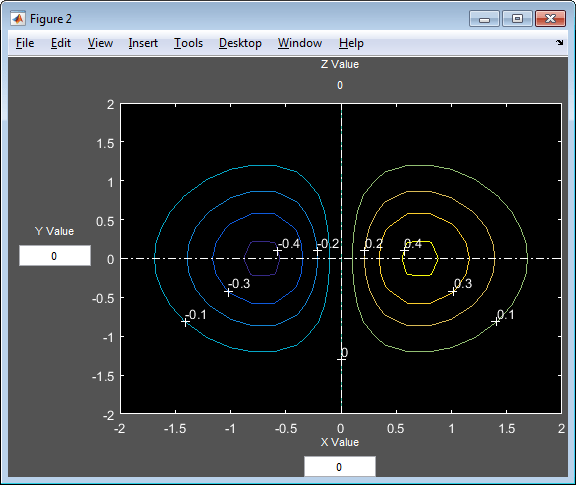
The figure shows a contour plot of the z values along the specified x- and y-axes.
Click the plot to evaluate z at the (x,y) coordinates indicated by the intersecting white lines.
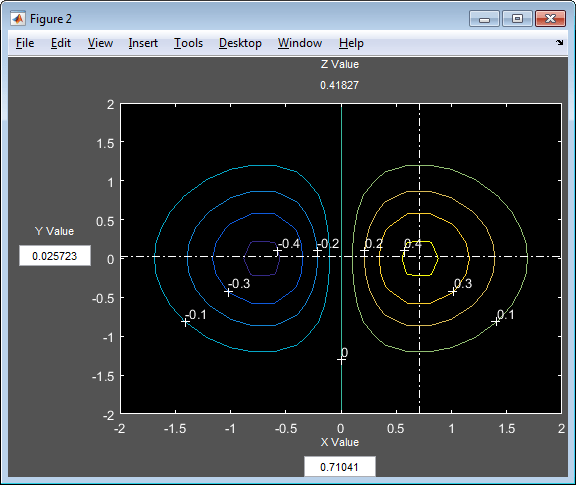
For example, at x = 0.71041 and y = 0.025723, the value of z is 0.41827.
Alternatively, enter values in the fields labeled X
Value
and Y Value
to evaluate z at
the specified coordinates. For example, evaluate z at x =
0.5 and y =
1.
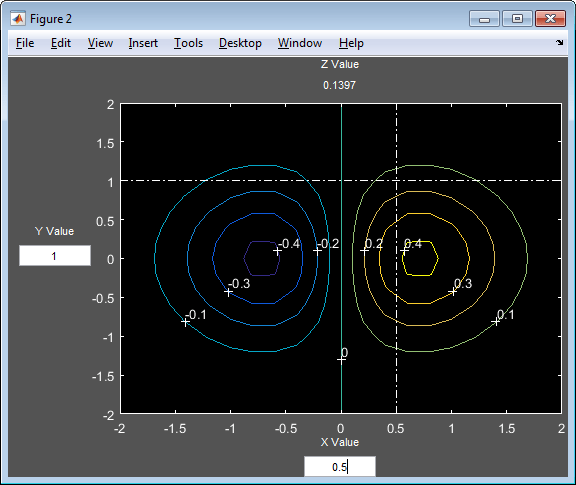
The value of z is 0.1397.
Input Arguments
z
— z-axis values for contour plot
numeric matrix
z-axis values for contour plot, specified as a numeric matrix.
surfht
treats the values in z
as
the height above the plane. By default, the x-axis
values of the plot are the column indices of z
,
and the y-axis values of the plot are the row indices
of z
. To change the x- and y-axis
values, specify x
and y
,
respectively.
Data Types: single
| double
x
— x-axis values for contour plot
column indices of z
(default) | numeric vector
x-axis values for contour plot, specified
as a numeric vector. The length of x
must match
the number of columns in z
.
Data Types: single
| double
y
— y-axis values for contour plot
row indices of z
(default) | numeric vector
y-axis values for contour plot, specified
as a numeric vector. The length of y
must match
the number of rows in z
.
Data Types: single
| double
Tips
The intersection of the vertical and horizontal reference lines on the interactive plot defines the current x value and y value.
Drag the dotted white reference lines to watch the interpolated z value (at the top of the plot) update simultaneously.
Alternatively, obtain a specific interpolated z value by typing the x value and y value into editable text fields on the x-axis and y-axis, respectively.
Version History
Introduced before R2006a
MATLAB 명령
다음 MATLAB 명령에 해당하는 링크를 클릭했습니다.
명령을 실행하려면 MATLAB 명령 창에 입력하십시오. 웹 브라우저는 MATLAB 명령을 지원하지 않습니다.
Select a Web Site
Choose a web site to get translated content where available and see local events and offers. Based on your location, we recommend that you select: .
You can also select a web site from the following list:
How to Get Best Site Performance
Select the China site (in Chinese or English) for best site performance. Other MathWorks country sites are not optimized for visits from your location.
Americas
- América Latina (Español)
- Canada (English)
- United States (English)
Europe
- Belgium (English)
- Denmark (English)
- Deutschland (Deutsch)
- España (Español)
- Finland (English)
- France (Français)
- Ireland (English)
- Italia (Italiano)
- Luxembourg (English)
- Netherlands (English)
- Norway (English)
- Österreich (Deutsch)
- Portugal (English)
- Sweden (English)
- Switzerland
- United Kingdom (English)