그룹화된 데이터를 사용하여 산점도 플롯 만들기
이 예제에서는 그룹화된 표본 데이터를 사용하여 산점도 플롯을 만드는 방법을 보여줍니다.
산점도 플롯은 한 변수를 다른 변수와 비교하는 단순한 플롯입니다. MATLAB® 함수 plot 및 scatter는 산점도 플롯을 생성합니다. MATLAB 함수 plotmatrix는 여러 쌍의 변수 사이의 관계를 나타내는 그러한 플롯으로 구성된 행렬을 생성할 수 있습니다.
Statistics and Machine Learning Toolbox™ 함수 gscatter 및 gplotmatrix는 이러한 플롯의 그룹화된 버전을 생성합니다. 이러한 함수는 두 변수의 값 또는 두 변수 간의 관계가 각 그룹에서 동일한지 여부를 확인하는 데 유용합니다. 또한 이러한 함수는 서로 다른 플로팅 기호를 사용하여 그룹 구성원을 나타냅니다. gname을 사용하여 텍스트 레이블 또는 관측값 번호로 플롯의 점에 레이블을 지정할 수 있습니다.
세 가지 다른 모델 연도에서 자동차의 무게와 주행거리를 검토하고자 한다고 가정하겠습니다
load carsmall
gscatter(Weight,MPG,Model_Year,'bgr','xos')
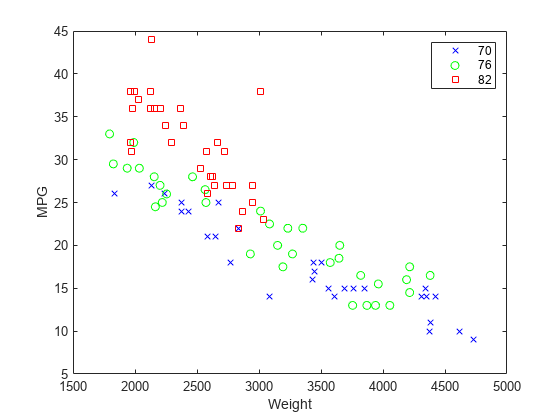
이 플롯은 자동차의 무게와 주행거리 간에 밀접한 관계가 있을 뿐만 아니라 신형 자동차가 구형 자동차보다 가볍고 연비가 좋은 경향이 있다는 것을 보여줍니다.
gscatter에 대한 디폴트 인수는 기호는 동일하지만 다른 색으로 표시된 여러 그룹으로 산점도 플롯을 생성합니다. 위의 마지막 두 인수는 모든 그룹이 디폴트 색과 서로 다른 기호로 표시되도록 요청합니다.
carsmall 데이터 세트는 자동차의 여러 가지 측면을 설명하는 기타 변수를 포함합니다. 그룹화된 플롯 행렬을 만들어 하나로 표시하면서 자동차의 여러 가지 측면을 검토할 수 있습니다.
xvars = [Weight Displacement Horsepower];
yvars = [MPG Acceleration];
gplotmatrix(xvars,yvars,Model_Year,'bgr','xos')
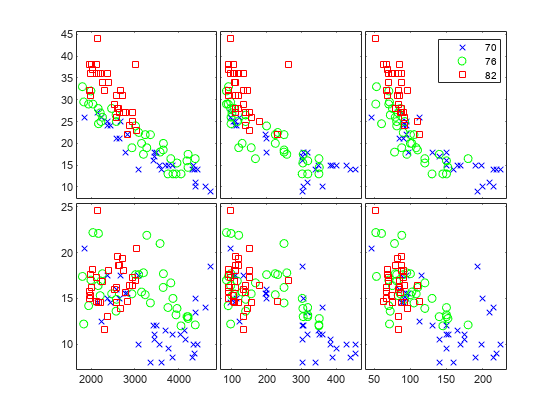
오른쪽 위 서브플롯은 Horsepower 대비 MPG를 나타내며 수년에 걸쳐 자동차의 마력은 감소했지만 연비는 개선되었음을 보여줍니다.
gplotmatrix 함수는 변수의 각 목록으로부터 얻을 수 있는 모든 쌍을 각 변수에 대한 히스토그램과 함께 그래프로 나타낼 수 있습니다. Perform Multivariate Analysis of Variance (MANOVA) 항목을 참조하십시오.
참고 항목
gscatter | gplotmatrix | gname
관련 항목
You can also select a web site from the following list:
Americas
- América Latina (Español)
- Canada (English)
- United States (English)
Europe
- Belgium (English)
- Denmark (English)
- Deutschland (Deutsch)
- España (Español)
- Finland (English)
- France (Français)
- Ireland (English)
- Italia (Italiano)
- Luxembourg (English)
- Netherlands (English)
- Norway (English)
- Österreich (Deutsch)
- Portugal (English)
- Sweden (English)
- Switzerland
- United Kingdom (English)