Accelerating Neurological Image Analysis with MATLAB at RIKEN Brain Science Institute
By Yuki Kobayashi, RIKEN Brain Science Institute, and Mohammad Muquit, MathWorks
At the RIKEN Brain Science Institute, we are investigating how the highly regulated mammalian central nervous system is established and how it is affected by environmental and genetic factors. As part of this research, we develop genetically mutant mice using standard genetics procedures, and study the behavioral phenotypes of these mice. Using this experimental data we link specific genes to behaviors by analyzing how areas of the brain respond to external stimuli such as odor, sound, and light. One goal is to better understand the molecular and cellular mechanisms underlying attention and impulsivity, and advance the treatment of related behavioral disorders.
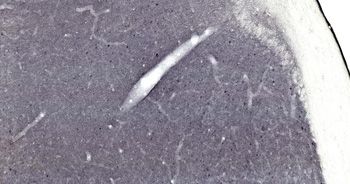
To quantify the activity in a specific region of the brain, we use brain slice imaging and standard enzyme-antibody staining to detect the expression level of c-Fos, a protein recognized as an indicator of neural activity. The dye turns active cells dark, enabling them to be identified and counted in microscopic images of the brain (Figure 1).
In analyzing the images, we encountered a challenge that arises frequently in neuroscience and biology labs: detecting and counting hundreds of spots in thousands of images. Our team worked with MathWorks consultants to develop a MATLAB® application that automates the detection of relevant spots and streamlines the processes used to manage image data in the lab. This application reduced the time needed to analyze a single image by a factor of 100, increased the number of samples the lab could analyze, identified spots that were missed during manual inspection, and simplified data management.
Analyzing Images Manually
Because a typical image processed by the lab contains between 300 and 400 spots, RIKEN researchers often spent 15 minutes or more analyzing each image. Approximately 100 images must be analyzed for each test subject, so it took days to process the images from just one mouse. The work was monotonous, and the results were vulnerable to biases and subjectivity. For example, we found that when an image had many spots, researchers tended to count certain dark areas that would be ignored in an image with fewer spots.
In addition to the effort needed to process a single image, our team spent a significant amount of time managing and tracking the data for all the images we handled. On occasion, files were temporarily misplaced, and it was difficult to keep track of images that needed further analysis.
To address these challenges, RIKEN contacted MathWorks consultants, who proposed developing an application with MATLAB and Image Processing Toolbox™ to automatically detect and count spots and help us streamline the data management workflow for experimental results.
Developing Algorithms to Identify Threshold Values
A key step in identifying spots in an image is finding a threshold value for pixel luminance, above which any dark area is deemed a spot. Once this threshold is established, it is used to convert the original grayscale image into a binary version in which each spot is completely white and the background is completely black, represented by 1 and 0, respectively. This threshold value, however, varies from image to image. More importantly, the most effective technique for identifying the threshold value may also vary from image to image.
The MathWorks consulting team implemented four distinct algorithms for finding threshold values. The first uses the graythresh function in Image Processing Toolbox to apply Otsu's method, which identifies a threshold that minimizes the intraclass variance of the black and white pixels. The second algorithm chooses the threshold based on global pixel density so that the percentage of pixels on each side of the threshold value is a function of global intensity variance. The third uses the same method as the second, but is based on local intensity variance rather than global. The fourth uses the same method as the third, but applies an extra step to separate connected dots, giving a more accurate count in images where many dots touch one another.
Image Preprocessing and Postprocessing
In addition to the algorithms developed for setting a threshold, the MathWorks consultants also implemented preprocessing and postprocessing steps to improve the effectiveness of the overall procedure.
Preprocessing steps include reducing the halation effect by adjusting contrast and intensity, reducing noise via a low-pass filter, and smoothing spot edges with morphological operations. Postprocessing steps applied to the binary image include median filtering and morphological operations that distinguish spots from noise and unrelated edges.
After postprocessing, blob analysis is performed on the image to count the number of dark spots and eliminate any remaining large dark areas or background noise.
The consultants tested the preprocessing, thresholding, postprocessing, and blob analysis operations on hundreds of images to refine the algorithms and fine-tune parameters.
Building a Graphical Interface
To make it easier for RIKEN researchers to use the image processing algorithms, the consulting team developed a MATLAB based interface (Figure 2).
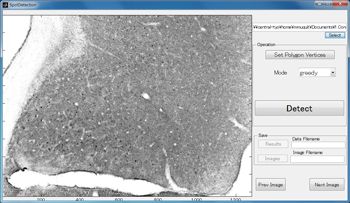
After loading the image to be processed, we use the interface to mark a region of interest (ROI) within the image (Figure 3).

We then choose the desired threshold algorithm and invoke the image processing algorithms. Spots identified by the algorithm are counted and outlined on the screen for review. We sometimes reprocess the image immediately using different thresholding methods before using the results produced by the most effective method for that particular image.
As a final step, we specify a MATLAB or Microsoft® Excel file in which to save the results, which include the number of spots, as well as the subject number, date, thresholding method, and ROI used.
Accelerating Research
Using the new MATLAB image processing application, we can analyze an image in seconds—significantly less time than the 15 minutes previously required. In the past, our team rarely performed neuroimaging analysis of an entire region of the brain (about 100 images) because it required so much time and effort. Instead of taking days, this analysis is now completed in minutes with MATLAB. Just as importantly, we achieve better results because the detection algorithms identify spots undetectable to the naked eye.
With the automated MATLAB system in place, we spend significantly less time on tedious counting tasks, freeing us to focus more of our attention and expertise on vital research activities. This extra time, coupled with the ability to process many more images than before, has led RIKEN to explore several new research paths not considered before, and has contributed to advances in our group’s research. For instance, we can now screen the entire brain region to find the ROI for a given stimulus, comparing different groups of genetically altered subjects.
We plan to implement image processing automation with MATLAB on similar research initiatives, including one in which a calcium indicator is used to highlight the response of a live cell to certain stimuli in a chromosome image and another involving in vivo signal analysis.
Published 2014 - 92179v00